Feature engineering
Defining the features
Low level feature engineering is performed in the user strategy within a set of functions called feature_engineering_*. These function set the base features such as, RSI, MFI, EMA, SMA, time of day, volume, etc. The base features can be custom indicators or they can be imported from any technical-analysis library that you can find. FreqAI is equipped with a set of functions to simplify rapid large-scale feature engineering:
| Function | Description |
|---|---|
feature_engineering_expand_all() |
This optional function will automatically expand the defined features on the config defined indicator_periods_candles, include_timeframes, include_shifted_candles, and include_corr_pairs. |
feature_engineering_expand_basic() |
This optional function will automatically expand the defined features on the config defined include_timeframes, include_shifted_candles, and include_corr_pairs. Note: this function does not expand across indicator_periods_candles. |
feature_engineering_standard() |
This optional function will be called once with the dataframe of the base timeframe. This is the final function to be called, which means that the dataframe entering this function will contain all the features and columns from the base asset created by the other feature_engineering_expand functions. This function is a good place to do custom exotic feature extractions (e.g. tsfresh). This function is also a good place for any feature that should not be auto-expanded upon (e.g., day of the week). |
set_freqai_targets() |
Required function to set the targets for the model. All targets must be prepended with & to be recognized by the FreqAI internals. |
Meanwhile, high level feature engineering is handled within "feature_parameters":{} in the FreqAI config. Within this file, it is possible to decide large scale feature expansions on top of the base_features such as "including correlated pairs" or "including informative timeframes" or even "including recent candles."
It is advisable to start from the template feature_engineering_* functions in the source provided example strategy (found in templates/FreqaiExampleStrategy.py) to ensure that the feature definitions are following the correct conventions. Here is an example of how to set the indicators and labels in the strategy:
    def feature_engineering_expand_all(self, dataframe: DataFrame, period, metadata, **kwargs) -> DataFrame:
        """
        *Only functional with FreqAI enabled strategies*
        This function will automatically expand the defined features on the config defined
        `indicator_periods_candles`, `include_timeframes`, `include_shifted_candles`, and
        `include_corr_pairs`. In other words, a single feature defined in this function
        will automatically expand to a total of
        `indicator_periods_candles` * `include_timeframes` * `include_shifted_candles` *
        `include_corr_pairs` numbers of features added to the model.

        All features must be prepended with `%` to be recognized by FreqAI internals.

        Access metadata such as the current pair/timeframe/period with:

        `metadata["pair"]` `metadata["tf"]`  `metadata["period"]`

        :param df: strategy dataframe which will receive the features
        :param period: period of the indicator - usage example:
        :param metadata: metadata of current pair
        dataframe["%-ema-period"] = ta.EMA(dataframe, timeperiod=period)
        """

        dataframe["%-rsi-period"] = ta.RSI(dataframe, timeperiod=period)
        dataframe["%-mfi-period"] = ta.MFI(dataframe, timeperiod=period)
        dataframe["%-adx-period"] = ta.ADX(dataframe, timeperiod=period)
        dataframe["%-sma-period"] = ta.SMA(dataframe, timeperiod=period)
        dataframe["%-ema-period"] = ta.EMA(dataframe, timeperiod=period)

        bollinger = qtpylib.bollinger_bands(
            qtpylib.typical_price(dataframe), window=period, stds=2.2
        )
        dataframe["bb_lowerband-period"] = bollinger["lower"]
        dataframe["bb_middleband-period"] = bollinger["mid"]
        dataframe["bb_upperband-period"] = bollinger["upper"]

        dataframe["%-bb_width-period"] = (
            dataframe["bb_upperband-period"]
            - dataframe["bb_lowerband-period"]
        ) / dataframe["bb_middleband-period"]
        dataframe["%-close-bb_lower-period"] = (
            dataframe["close"] / dataframe["bb_lowerband-period"]
        )

        dataframe["%-roc-period"] = ta.ROC(dataframe, timeperiod=period)

        dataframe["%-relative_volume-period"] = (
            dataframe["volume"] / dataframe["volume"].rolling(period).mean()
        )

        return dataframe

    def feature_engineering_expand_basic(self, dataframe: DataFrame, metadata, **kwargs) -> DataFrame:
        """
        *Only functional with FreqAI enabled strategies*
        This function will automatically expand the defined features on the config defined
        `include_timeframes`, `include_shifted_candles`, and `include_corr_pairs`.
        In other words, a single feature defined in this function
        will automatically expand to a total of
        `include_timeframes` * `include_shifted_candles` * `include_corr_pairs`
        numbers of features added to the model.

        Features defined here will *not* be automatically duplicated on user defined
        `indicator_periods_candles`

        Access metadata such as the current pair/timeframe with:

        `metadata["pair"]` `metadata["tf"]`

        All features must be prepended with `%` to be recognized by FreqAI internals.

        :param df: strategy dataframe which will receive the features
        :param metadata: metadata of current pair
        dataframe["%-pct-change"] = dataframe["close"].pct_change()
        dataframe["%-ema-200"] = ta.EMA(dataframe, timeperiod=200)
        """
        dataframe["%-pct-change"] = dataframe["close"].pct_change()
        dataframe["%-raw_volume"] = dataframe["volume"]
        dataframe["%-raw_price"] = dataframe["close"]
        return dataframe

    def feature_engineering_standard(self, dataframe: DataFrame, metadata, **kwargs) -> DataFrame:
        """
        *Only functional with FreqAI enabled strategies*
        This optional function will be called once with the dataframe of the base timeframe.
        This is the final function to be called, which means that the dataframe entering this
        function will contain all the features and columns created by all other
        freqai_feature_engineering_* functions.

        This function is a good place to do custom exotic feature extractions (e.g. tsfresh).
        This function is a good place for any feature that should not be auto-expanded upon
        (e.g. day of the week).

        Access metadata such as the current pair with:

        `metadata["pair"]`

        All features must be prepended with `%` to be recognized by FreqAI internals.

        :param df: strategy dataframe which will receive the features
        :param metadata: metadata of current pair
        usage example: dataframe["%-day_of_week"] = (dataframe["date"].dt.dayofweek + 1) / 7
        """
        dataframe["%-day_of_week"] = (dataframe["date"].dt.dayofweek + 1) / 7
        dataframe["%-hour_of_day"] = (dataframe["date"].dt.hour + 1) / 25
        return dataframe

    def set_freqai_targets(self, dataframe: DataFrame, metadata, **kwargs) -> DataFrame:
        """
        *Only functional with FreqAI enabled strategies*
        Required function to set the targets for the model.
        All targets must be prepended with `&` to be recognized by the FreqAI internals.

        Access metadata such as the current pair with:

        `metadata["pair"]`

        :param df: strategy dataframe which will receive the targets
        :param metadata: metadata of current pair
        usage example: dataframe["&-target"] = dataframe["close"].shift(-1) / dataframe["close"]
        """
        dataframe["&-s_close"] = (
            dataframe["close"]
            .shift(-self.freqai_info["feature_parameters"]["label_period_candles"])
            .rolling(self.freqai_info["feature_parameters"]["label_period_candles"])
            .mean()
            / dataframe["close"]
            - 1
            )

        return dataframe
In the presented example, the user does not wish to pass the bb_lowerband as a feature to the model,
and has therefore not prepended it with %. The user does, however, wish to pass bb_width to the
model for training/prediction and has therefore prepended it with %.
After having defined the base features, the next step is to expand upon them using the powerful feature_parameters in the configuration file:
    "freqai": {
        //...
        "feature_parameters" : {
            "include_timeframes": ["5m","15m","4h"],
            "include_corr_pairlist": [
                "ETH/USD",
                "LINK/USD",
                "BNB/USD"
            ],
            "label_period_candles": 24,
            "include_shifted_candles": 2,
            "indicator_periods_candles": [10, 20]
        },
        //...
    }
The include_timeframes in the config above are the timeframes (tf) of each call to feature_engineering_expand_*() in the strategy. In the presented case, the user is asking for the 5m, 15m, and 4h timeframes of the rsi, mfi, roc, and bb_width to be included in the feature set.
You can ask for each of the defined features to be included also for informative pairs using the include_corr_pairlist. This means that the feature set will include all the features from feature_engineering_expand_*() on all the include_timeframes for each of the correlated pairs defined in the config (ETH/USD, LINK/USD, and BNB/USD in the presented example).
include_shifted_candles indicates the number of previous candles to include in the feature set. For example, include_shifted_candles: 2 tells FreqAI to include the past 2 candles for each of the features in the feature set.
In total, the number of features the user of the presented example strategy has created is: length of include_timeframes * no. features in feature_engineering_expand_*() * length of include_corr_pairlist * no. include_shifted_candles * length of indicator_periods_candles
\(= 3 * 3 * 3 * 2 * 2 = 108\).
Learn more about creative feature engineering
Check out our medium article geared toward helping users learn how to creatively engineer features.
Gain finer control over feature_engineering_* functions with metadata
All feature_engineering_* and set_freqai_targets() functions are passed a metadata dictionary which contains information about the pair, tf (timeframe), and period that FreqAI is automating for feature building. As such, a user can use metadata inside feature_engineering_* functions as criteria for blocking/reserving features for certain timeframes, periods, pairs etc.
def feature_engineering_expand_all(self, dataframe: DataFrame, period, metadata, **kwargs) -> DataFrame:
    if metadata["tf"] == "1h":
        dataframe["%-roc-period"] = ta.ROC(dataframe, timeperiod=period)
This will block ta.ROC() from being added to any timeframes other than "1h".
Returning additional info from training
Important metrics can be returned to the strategy at the end of each model training by assigning them to dk.data['extra_returns_per_train']['my_new_value'] = XYZ inside the custom prediction model class.
FreqAI takes the my_new_value assigned in this dictionary and expands it to fit the dataframe that is returned to the strategy. You can then use the returned metrics in your strategy through dataframe['my_new_value']. An example of how return values can be used in FreqAI are the &*_mean and &*_std values that are used to created a dynamic target threshold.
Another example, where the user wants to use live metrics from the trade database, is shown below:
    "freqai": {
        "extra_returns_per_train": {"total_profit": 4}
    }
You need to set the standard dictionary in the config so that FreqAI can return proper dataframe shapes. These values will likely be overridden by the prediction model, but in the case where the model has yet to set them, or needs a default initial value, the pre-set values are what will be returned.
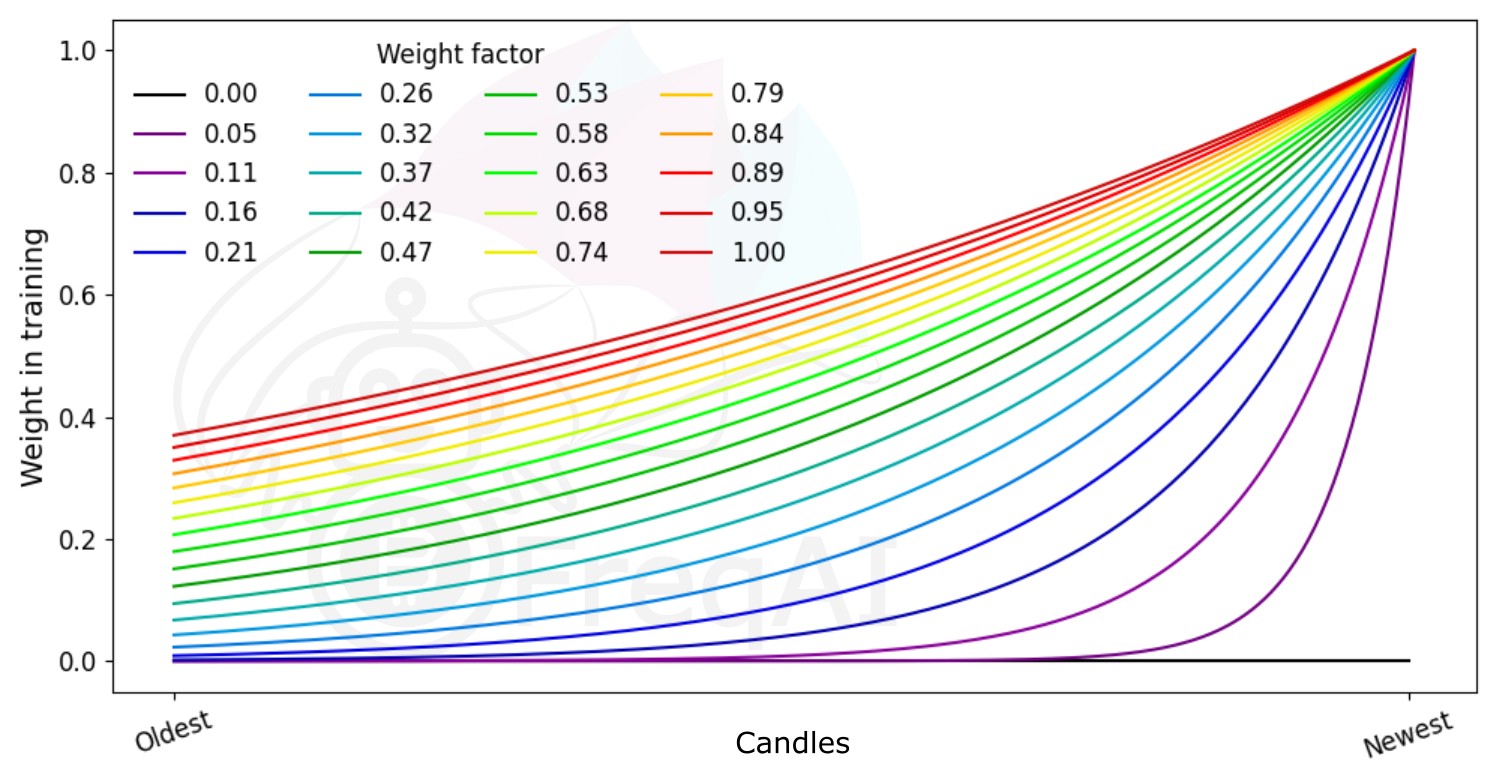
Weighting features for temporal importance
FreqAI allows you to set a weight_factor to weight recent data more strongly than past data via an exponential function:
where \(W_i\) is the weight of data point \(i\) in a total set of \(n\) data points. Below is a figure showing the effect of different weight factors on the data points in a feature set.
Building the data pipeline
By default, FreqAI builds a dynamic pipeline based on user configuration settings. The default settings are robust and designed to work with a variety of methods. These two steps are a MinMaxScaler(-1,1) and a VarianceThreshold which removes any column that has 0 variance. Users can activate other steps with more configuration parameters. For example if users add use_SVM_to_remove_outliers: true to the freqai config, then FreqAI will automatically add the SVMOutlierExtractor to the pipeline. Likewise, users can add principal_component_analysis: true to the freqai config to activate PCA. The DissimilarityIndex is activated with DI_threshold: 1. Finally, noise can also be added to the data with noise_standard_deviation: 0.1. Finally, users can add DBSCAN outlier removal with use_DBSCAN_to_remove_outliers: true.
More information available
Please review the parameter table for more information on these parameters.
Customizing the pipeline
Users are encouraged to customize the data pipeline to their needs by building their own data pipeline. This can be done by simply setting dk.feature_pipeline to their desired Pipeline object inside their IFreqaiModel train() function, or if they prefer not to touch the train() function, they can override define_data_pipeline/define_label_pipeline functions in their IFreqaiModel:
More information available
FreqAI uses the DataSieve pipeline, which follows the SKlearn pipeline API, but adds, among other features, coherence between the X, y, and sample_weight vector point removals, feature removal, feature name following.
from datasieve.transforms import SKLearnWrapper, DissimilarityIndex
from datasieve.pipeline import Pipeline
from sklearn.preprocessing import QuantileTransformer, StandardScaler
from freqai.base_models import BaseRegressionModel


class MyFreqaiModel(BaseRegressionModel):
    """
    Some cool custom model
    """
    def fit(self, data_dictionary: Dict, dk: FreqaiDataKitchen, **kwargs) -> Any:
        """
        My custom fit function
        """
        model = cool_model.fit()
        return model

    def define_data_pipeline(self) -> Pipeline:
        """
        User defines their custom feature pipeline here (if they wish)
        """
        feature_pipeline = Pipeline([
            ('qt', SKLearnWrapper(QuantileTransformer(output_distribution='normal'))),
            ('di', ds.DissimilarityIndex(di_threshold=1))
        ])

        return feature_pipeline

    def define_label_pipeline(self) -> Pipeline:
        """
        User defines their custom label pipeline here (if they wish)
        """
        label_pipeline = Pipeline([
            ('qt', SKLearnWrapper(StandardScaler())),
        ])

        return label_pipeline
Here, you are defining the exact pipeline that will be used for your feature set during training and prediction. You can use most SKLearn transformation steps by wrapping them in the SKLearnWrapper class as shown above. In addition, you can use any of the transformations available in the DataSieve library.
You can easily add your own transformation by creating a class that inherits from the datasieve BaseTransform and implementing your fit(), transform() and inverse_transform() methods:
from datasieve.transforms.base_transform import BaseTransform
# import whatever else you need

class MyCoolTransform(BaseTransform):
    def __init__(self, **kwargs):
        self.param1 = kwargs.get('param1', 1)

    def fit(self, X, y=None, sample_weight=None, feature_list=None, **kwargs):
        # do something with X, y, sample_weight, or/and feature_list
        return X, y, sample_weight, feature_list

    def transform(self, X, y=None, sample_weight=None,
                  feature_list=None, outlier_check=False, **kwargs):
        # do something with X, y, sample_weight, or/and feature_list
        return X, y, sample_weight, feature_list

    def inverse_transform(self, X, y=None, sample_weight=None, feature_list=None, **kwargs):
        # do/dont do something with X, y, sample_weight, or/and feature_list
        return X, y, sample_weight, feature_list
Hint
You can define this custom class in the same file as your IFreqaiModel.
Migrating a custom IFreqaiModel to the new Pipeline
If you have created your own custom IFreqaiModel with a custom train()/predict() function, and you still rely on data_cleaning_train/predict(), then you will need to migrate to the new pipeline. If your model does not rely on data_cleaning_train/predict(), then you do not need to worry about this migration.
More details about the migration can be found here.
Outlier detection
Equity and crypto markets suffer from a high level of non-patterned noise in the form of outlier data points. FreqAI implements a variety of methods to identify such outliers and hence mitigate risk.
Identifying outliers with the Dissimilarity Index (DI)
The Dissimilarity Index (DI) aims to quantify the uncertainty associated with each prediction made by the model.
You can tell FreqAI to remove outlier data points from the training/test data sets using the DI by including the following statement in the config:
    "freqai": {
        "feature_parameters" : {
            "DI_threshold": 1
        }
    }
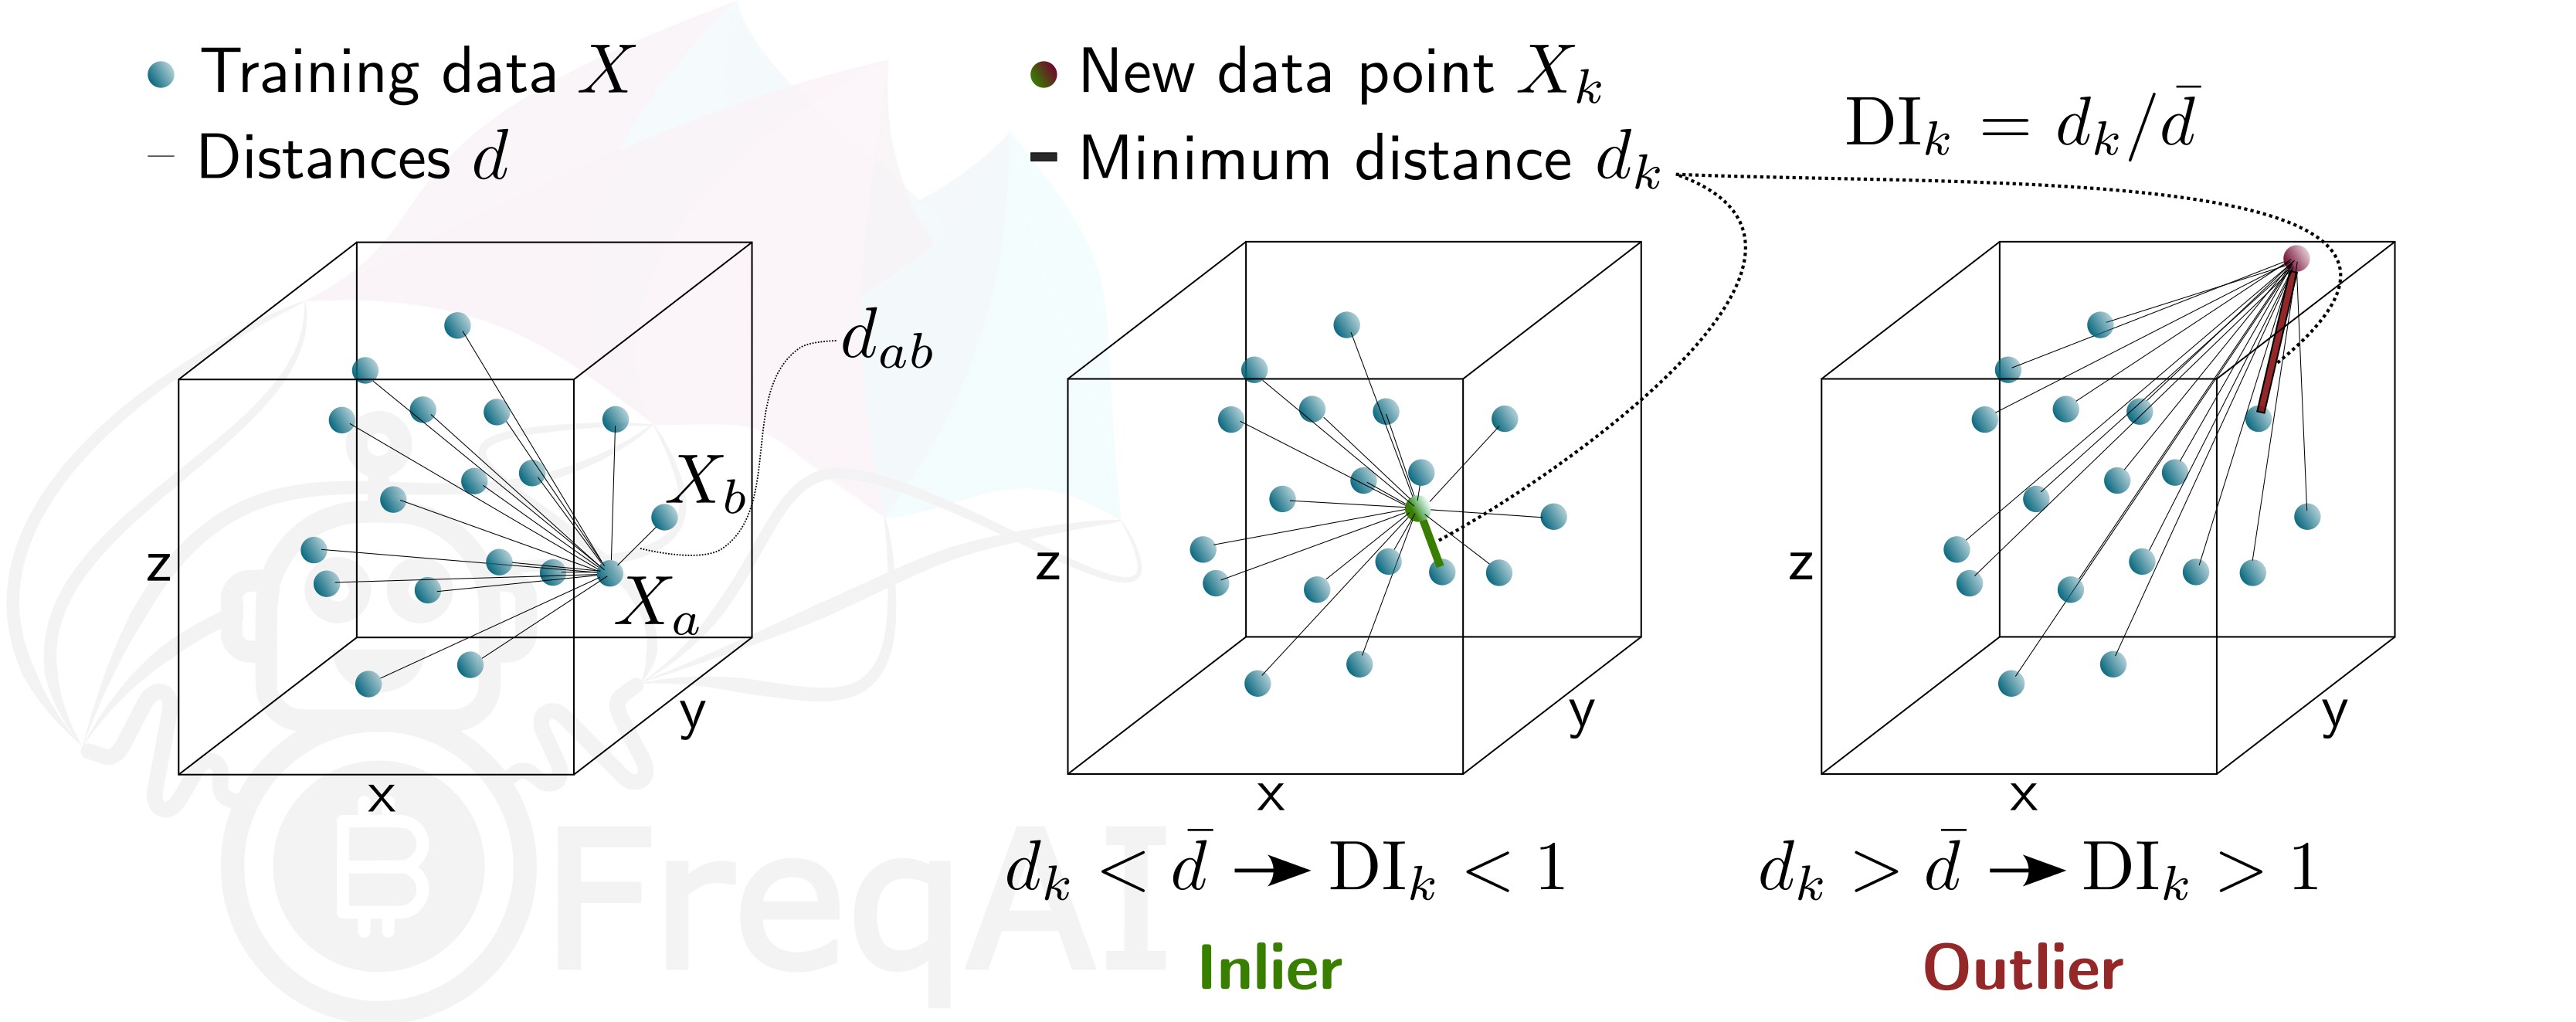
Which will add DissimilarityIndex step to your feature_pipeline and set the threshold to 1. The DI allows predictions which are outliers (not existent in the model feature space) to be thrown out due to low levels of certainty. To do so, FreqAI measures the distance between each training data point (feature vector), \(X_{a}\), and all other training data points:
where \(d_{ab}\) is the distance between the normalized points \(a\) and \(b\), and \(p\) is the number of features, i.e., the length of the vector \(X\). The characteristic distance, \(\overline{d}\), for a set of training data points is simply the mean of the average distances:
\(\overline{d}\) quantifies the spread of the training data, which is compared to the distance between a new prediction feature vectors, \(X_k\) and all the training data:
This enables the estimation of the Dissimilarity Index as:
You can tweak the DI through the DI_threshold to increase or decrease the extrapolation of the trained model. A higher DI_threshold means that the DI is more lenient and allows predictions further away from the training data to be used whilst a lower DI_threshold has the opposite effect and hence discards more predictions.
Below is a figure that describes the DI for a 3D data set.
Identifying outliers using a Support Vector Machine (SVM)
You can tell FreqAI to remove outlier data points from the training/test data sets using a Support Vector Machine (SVM) by including the following statement in the config:
    "freqai": {
        "feature_parameters" : {
            "use_SVM_to_remove_outliers": true
        }
    }
Which will add SVMOutlierExtractor step to your feature_pipeline. The SVM will be trained on the training data and any data point that the SVM deems to be beyond the feature space will be removed.
You can elect to provide additional parameters for the SVM, such as shuffle, and nu via the feature_parameters.svm_params dictionary in the config.
The parameter shuffle is by default set to False to ensure consistent results. If it is set to True, running the SVM multiple times on the same data set might result in different outcomes due to max_iter being to low for the algorithm to reach the demanded tol. Increasing max_iter solves this issue but causes the procedure to take longer time.
The parameter nu, very broadly, is the amount of data points that should be considered outliers and should be between 0 and 1.
Identifying outliers with DBSCAN
You can configure FreqAI to use DBSCAN to cluster and remove outliers from the training/test data set or incoming outliers from predictions, by activating use_DBSCAN_to_remove_outliers in the config:
    "freqai": {
        "feature_parameters" : {
            "use_DBSCAN_to_remove_outliers": true
        }
    }
Which will add the DataSieveDBSCAN step to your feature_pipeline. This is an unsupervised machine learning algorithm that clusters data without needing to know how many clusters there should be.
Given a number of data points \(N\), and a distance \(\varepsilon\), DBSCAN clusters the data set by setting all data points that have \(N-1\) other data points within a distance of \(\varepsilon\) as core points. A data point that is within a distance of \(\varepsilon\) from a core point but that does not have \(N-1\) other data points within a distance of \(\varepsilon\) from itself is considered an edge point. A cluster is then the collection of core points and edge points. Data points that have no other data points at a distance \(<\varepsilon\) are considered outliers. The figure below shows a cluster with \(N = 3\).
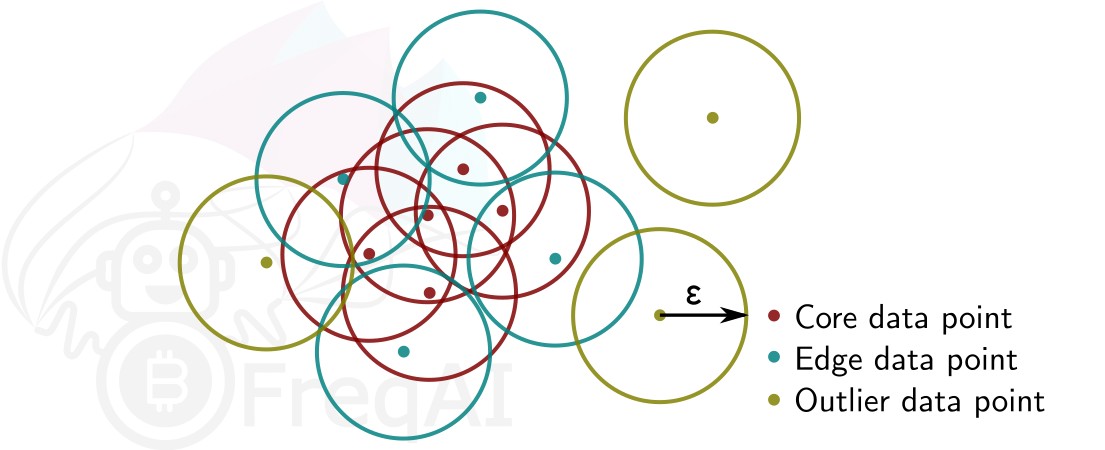
FreqAI uses sklearn.cluster.DBSCAN (details are available on scikit-learn's webpage here (external website)) with min_samples (\(N\)) taken as ¼ of the no. of time points (candles) in the feature set. eps (\(\varepsilon\)) is computed automatically as the elbow point in the k-distance graph computed from the nearest neighbors in the pairwise distances of all data points in the feature set.
Data dimensionality reduction with Principal Component Analysis
You can reduce the dimensionality of your features by activating the principal_component_analysis in the config:
    "freqai": {
        "feature_parameters" : {
            "principal_component_analysis": true
        }
    }
This will perform PCA on the features and reduce their dimensionality so that the explained variance of the data set is >= 0.999. Reducing data dimensionality makes training the model faster and hence allows for more up-to-date models.