Plotting
This page explains how to plot prices, indicators and profits.
Installation / Setup
Plotting modules use the Plotly library. You can install / upgrade this by running the following command:
pip install -U -r requirements-plot.txt
Plot price and indicators
The freqtrade plot-dataframe subcommand shows an interactive graph with three subplots:
- Main plot with candlestics and indicators following price (sma/ema)
- Volume bars
- Additional indicators as specified by
--indicators2
Possible arguments:
usage: freqtrade plot-dataframe [-h] [-v] [--logfile FILE] [-V] [-c PATH]
                                [-d PATH] [--userdir PATH] [-s NAME]
                                [--strategy-path PATH] [-p PAIRS [PAIRS ...]]
                                [--indicators1 INDICATORS1 [INDICATORS1 ...]]
                                [--indicators2 INDICATORS2 [INDICATORS2 ...]]
                                [--plot-limit INT] [--db-url PATH]
                                [--trade-source {DB,file}] [--export EXPORT]
                                [--export-filename PATH]
                                [--timerange TIMERANGE] [-i TIMEFRAME]
                                [--no-trades]

optional arguments:
  -h, --help            show this help message and exit
  -p PAIRS [PAIRS ...], --pairs PAIRS [PAIRS ...]
                        Show profits for only these pairs. Pairs are space-
                        separated.
  --indicators1 INDICATORS1 [INDICATORS1 ...]
                        Set indicators from your strategy you want in the
                        first row of the graph. Space-separated list. Example:
                        `ema3 ema5`. Default: `['sma', 'ema3', 'ema5']`.
  --indicators2 INDICATORS2 [INDICATORS2 ...]
                        Set indicators from your strategy you want in the
                        third row of the graph. Space-separated list. Example:
                        `fastd fastk`. Default: `['macd', 'macdsignal']`.
  --plot-limit INT      Specify tick limit for plotting. Notice: too high
                        values cause huge files. Default: 750.
  --db-url PATH         Override trades database URL, this is useful in custom
                        deployments (default: `sqlite:///tradesv3.sqlite` for
                        Live Run mode, `sqlite:///tradesv3.dryrun.sqlite` for
                        Dry Run).
  --trade-source {DB,file}
                        Specify the source for trades (Can be DB or file
                        (backtest file)) Default: file
  --export EXPORT       Export backtest results, argument are: trades.
                        Example: `--export=trades`
  --export-filename PATH
                        Save backtest results to the file with this filename.
                        Requires `--export` to be set as well. Example:
                        `--export-filename=user_data/backtest_results/backtest
                        _today.json`
  --timerange TIMERANGE
                        Specify what timerange of data to use.
  -i TIMEFRAME, --timeframe TIMEFRAME, --ticker-interval TIMEFRAME
                        Specify ticker interval (`1m`, `5m`, `30m`, `1h`,
                        `1d`).
  --no-trades           Skip using trades from backtesting file and DB.

Common arguments:
  -v, --verbose         Verbose mode (-vv for more, -vvv to get all messages).
  --logfile FILE        Log to the file specified. Special values are:
                        'syslog', 'journald'. See the documentation for more
                        details.
  -V, --version         show program's version number and exit
  -c PATH, --config PATH
                        Specify configuration file (default:
                        `userdir/config.json` or `config.json` whichever
                        exists). Multiple --config options may be used. Can be
                        set to `-` to read config from stdin.
  -d PATH, --datadir PATH
                        Path to directory with historical backtesting data.
  --userdir PATH, --user-data-dir PATH
                        Path to userdata directory.

Strategy arguments:
  -s NAME, --strategy NAME
                        Specify strategy class name which will be used by the
                        bot.
  --strategy-path PATH  Specify additional strategy lookup path.
Example:
freqtrade plot-dataframe -p BTC/ETH
The -p/--pairs argument can be used to specify pairs you would like to plot.
Note
The freqtrade plot-dataframe subcommand generates one plot-file per pair.
Specify custom indicators.
Use --indicators1 for the main plot and --indicators2 for the subplot below (if values are in a different range than prices).
Tip
You will almost certainly want to specify a custom strategy! This can be done by adding -s Classname / --strategy ClassName to the command.
freqtrade plot-dataframe --strategy AwesomeStrategy -p BTC/ETH --indicators1 sma ema --indicators2 macd
Further usage examples
To plot multiple pairs, separate them with a space:
freqtrade plot-dataframe --strategy AwesomeStrategy -p BTC/ETH XRP/ETH
To plot a timerange (to zoom in)
freqtrade plot-dataframe --strategy AwesomeStrategy -p BTC/ETH --timerange=20180801-20180805
To plot trades stored in a database use --db-url in combination with --trade-source DB:
freqtrade plot-dataframe --strategy AwesomeStrategy --db-url sqlite:///tradesv3.dry_run.sqlite -p BTC/ETH --trade-source DB
To plot trades from a backtesting result, use --export-filename <filename>
freqtrade plot-dataframe --strategy AwesomeStrategy --export-filename user_data/backtest_results/backtest-result.json -p BTC/ETH
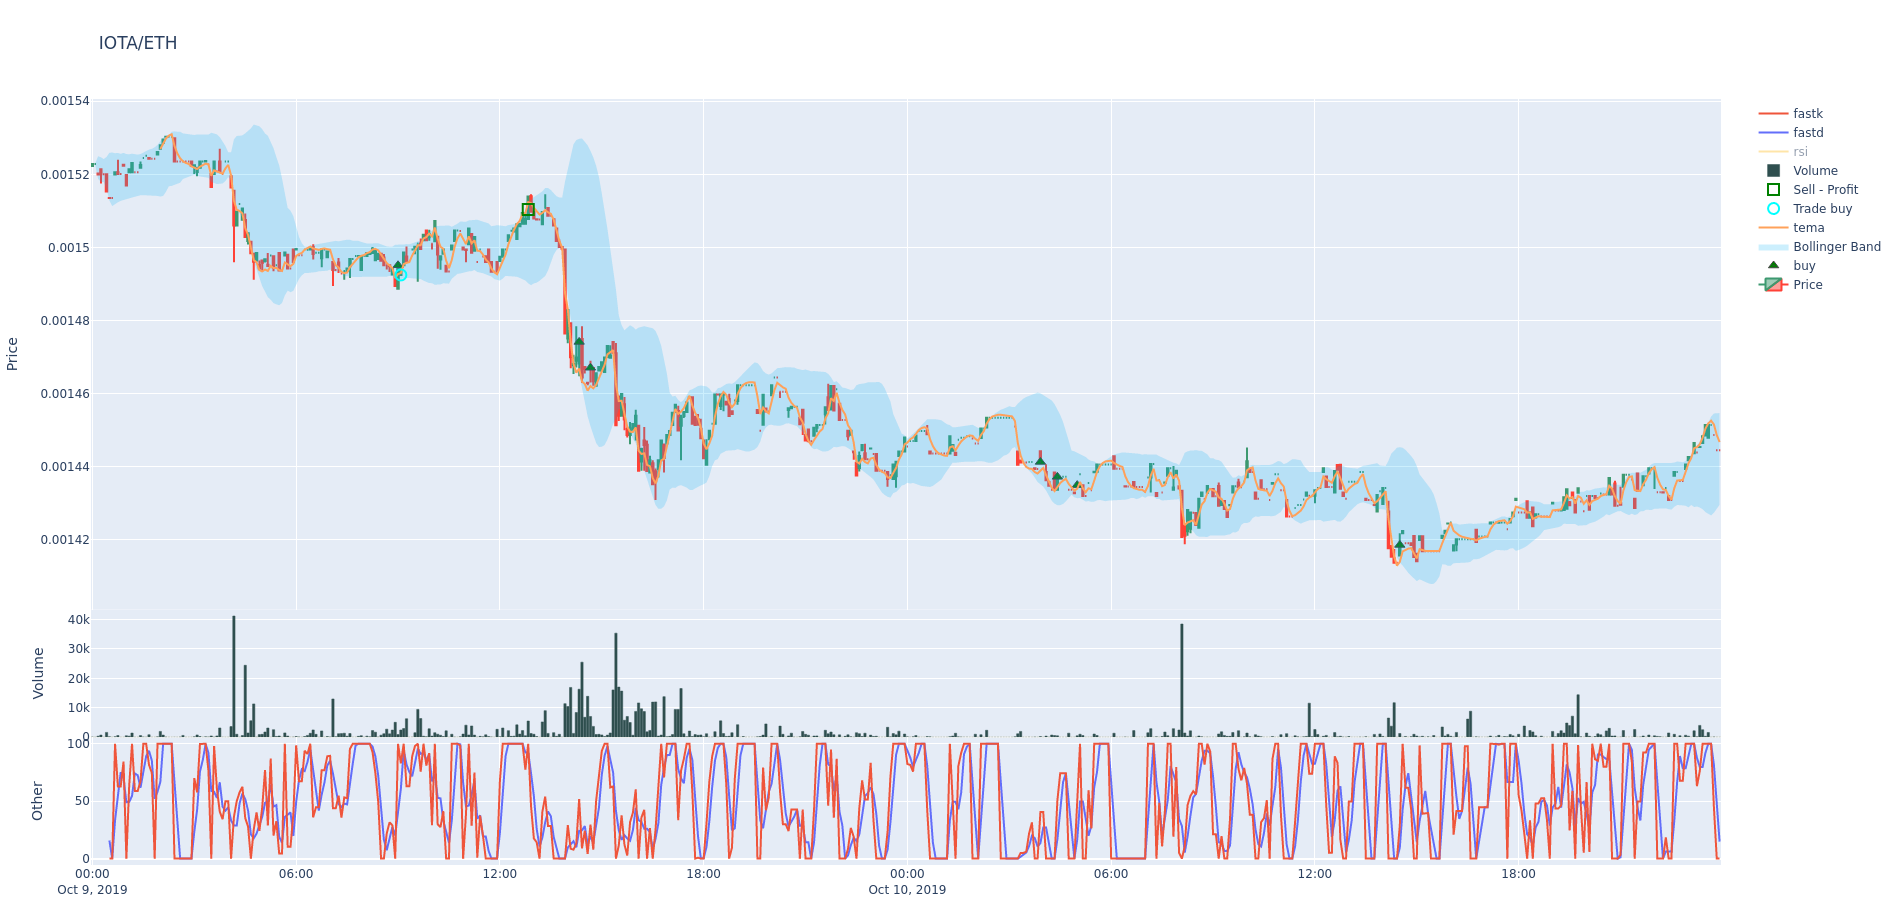
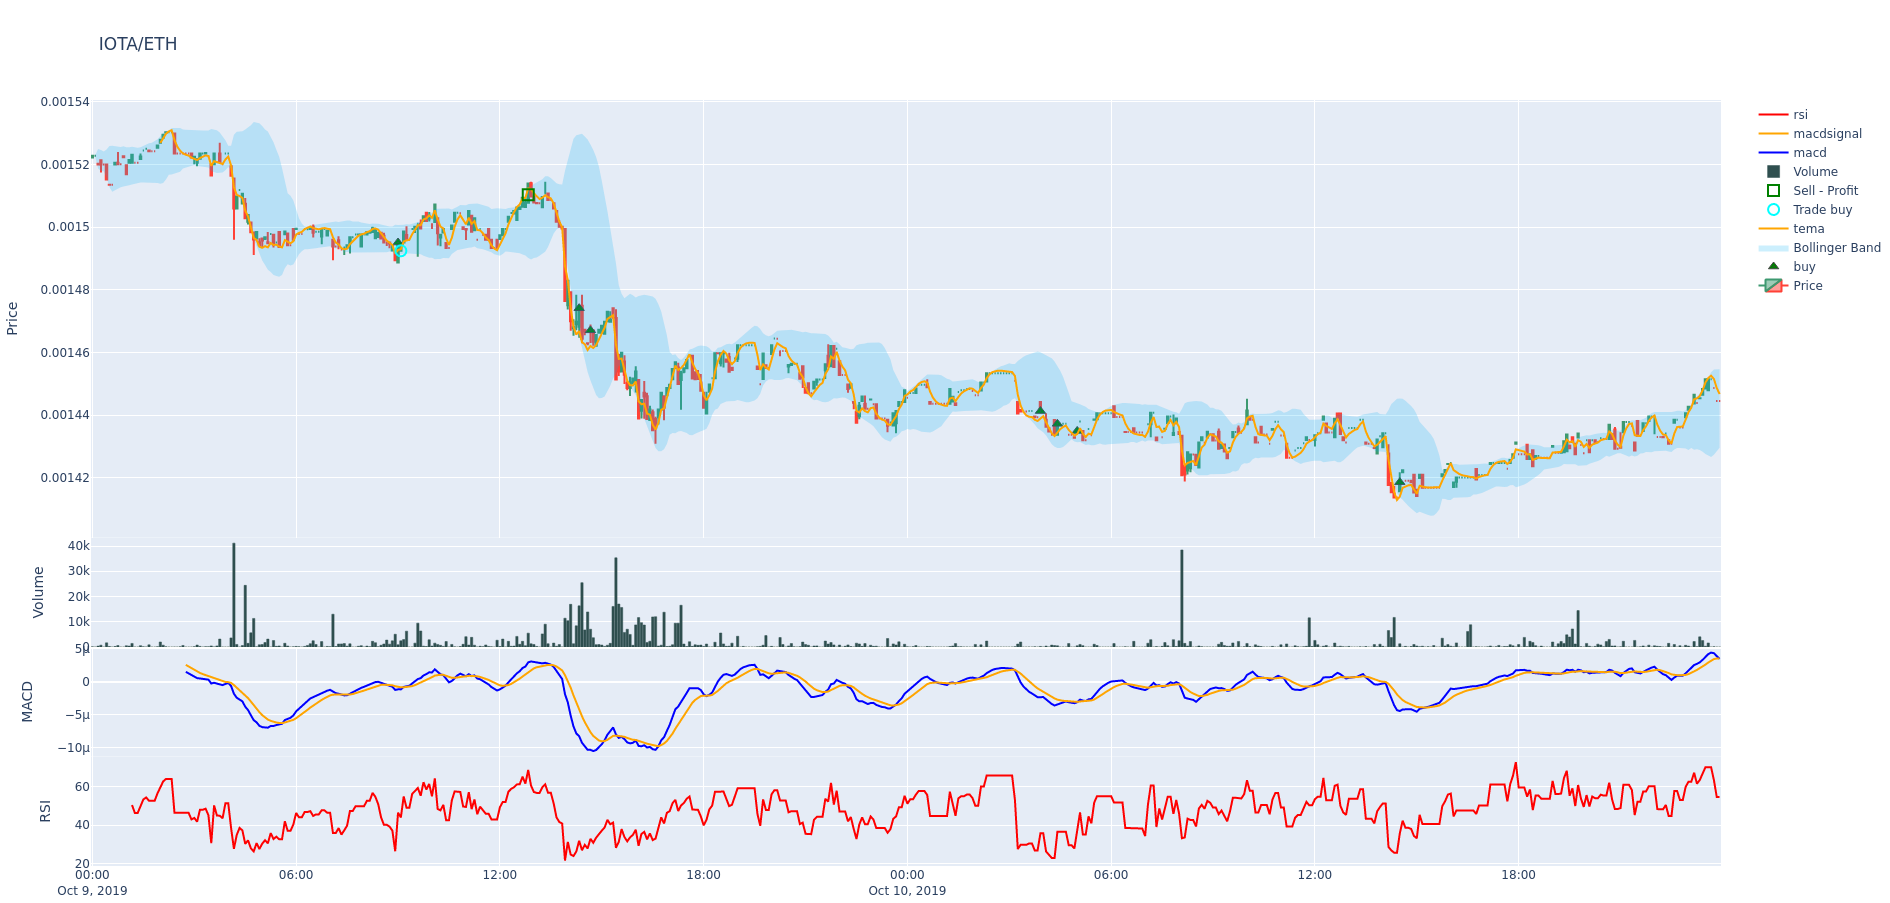
Plot dataframe basics
The plot-dataframe subcommand requires backtesting data, a strategy and either a backtesting-results file or a database, containing trades corresponding to the strategy.
The resulting plot will have the following elements:
- Green triangles: Buy signals from the strategy. (Note: not every buy signal generates a trade, compare to cyan circles.)
- Red triangles: Sell signals from the strategy. (Also, not every sell signal terminates a trade, compare to red and green squares.)
- Cyan circles: Trade entry points.
- Red squares: Trade exit points for trades with loss or 0% profit.
- Green squares: Trade exit points for profitable trades.
- Indicators with values corresponding to the candle scale (e.g. SMA/EMA), as specified with
--indicators1. - Volume (bar chart at the bottom of the main chart).
- Indicators with values in different scales (e.g. MACD, RSI) below the volume bars, as specified with
--indicators2.
Bollinger Bands
Bollinger bands are automatically added to the plot if the columns bb_lowerband and bb_upperband exist, and are painted as a light blue area spanning from the lower band to the upper band.
Advanced plot configuration
An advanced plot configuration can be specified in the strategy in the plot_config parameter.
Additional features when using plot_config include:
- Specify colors per indicator
- Specify additional subplots
The sample plot configuration below specifies fixed colors for the indicators. Otherwise consecutive plots may produce different colorschemes each time, making comparisons difficult. It also allows multiple subplots to display both MACD and RSI at the same time.
Sample configuration with inline comments explaining the process:
    plot_config = {
        'main_plot': {
            # Configuration for main plot indicators.
            # Specifies `ema10` to be red, and `ema50` to be a shade of gray
            'ema10': {'color': 'red'},
            'ema50': {'color': '#CCCCCC'},
            # By omitting color, a random color is selected.
            'sar': {},
        },
        'subplots': {
            # Create subplot MACD
            "MACD": {
                'macd': {'color': 'blue'},
                'macdsignal': {'color': 'orange'},
            },
            # Additional subplot RSI
            "RSI": {
                'rsi': {'color': 'red'},
            }
        }
    }
Note
The above configuration assumes that ema10, ema50, macd, macdsignal and rsi are columns in the DataFrame created by the strategy.
Plot profit
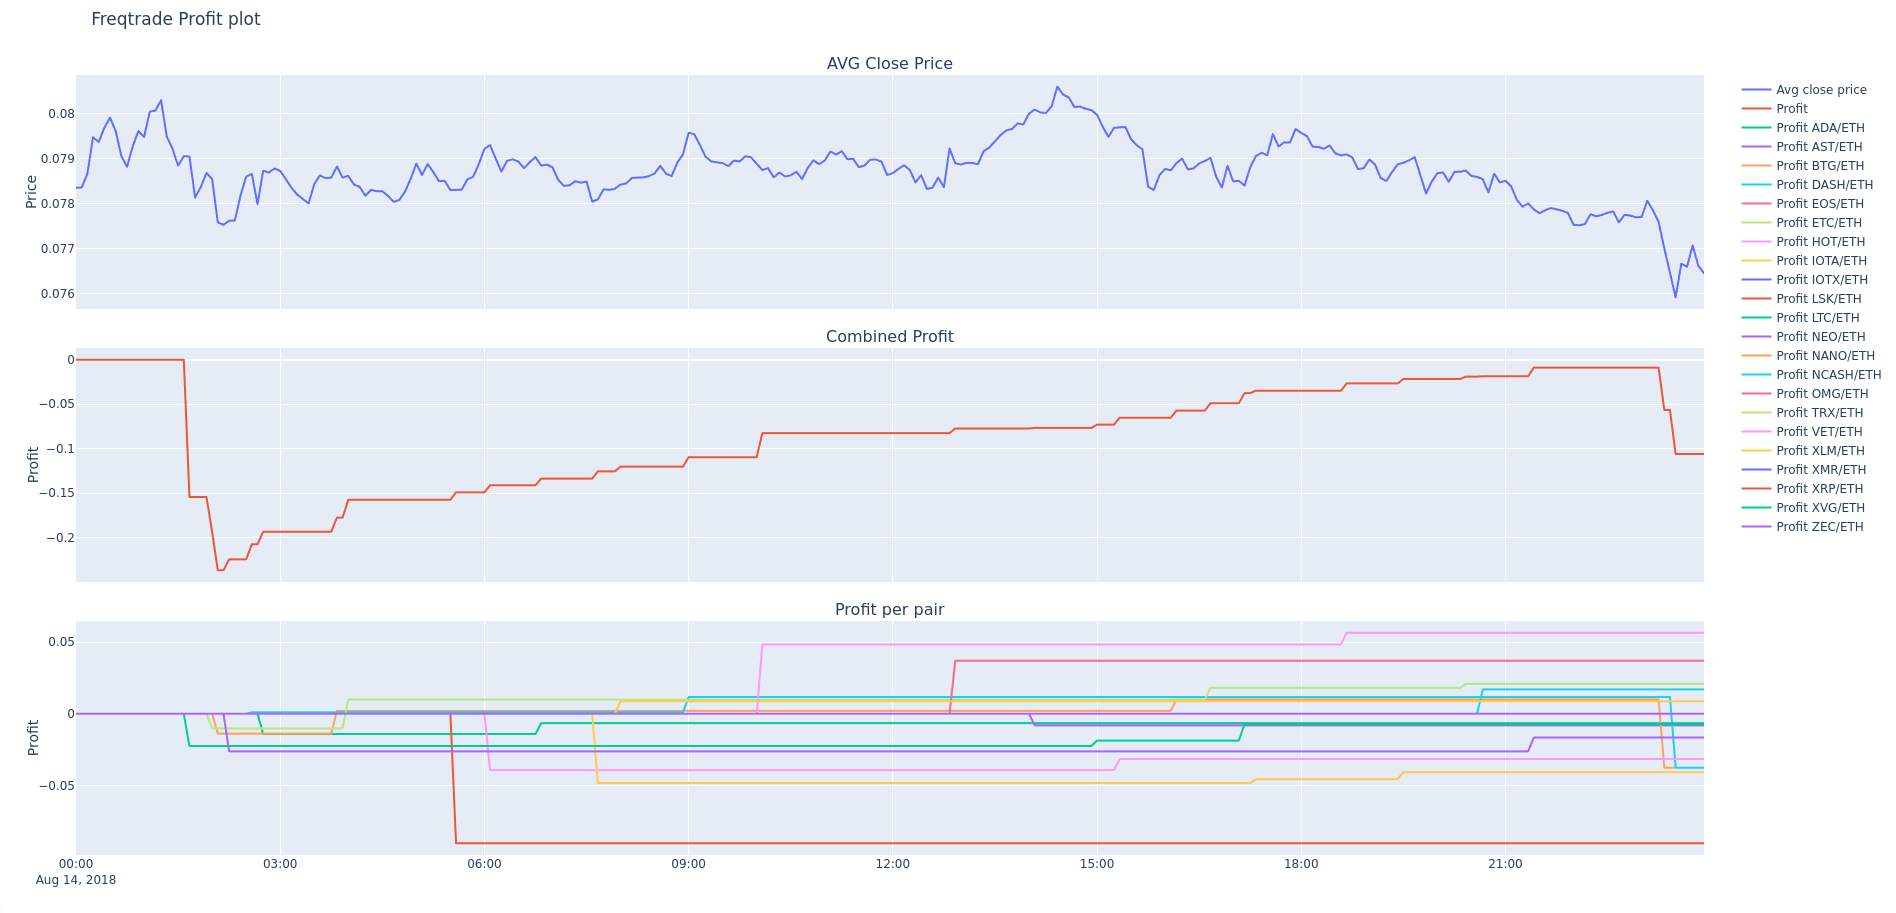
The plot-profit subcommand shows an interactive graph with three plots:
- Average closing price for all pairs.
- The summarized profit made by backtesting. Note that this is not the real-world profit, but more of an estimate.
- Profit for each individual pair.
The first graph is good to get a grip of how the overall market progresses.
The second graph will show if your algorithm works or doesn't. Perhaps you want an algorithm that steadily makes small profits, or one that acts less often, but makes big swings. This graph will also highlight the start (and end) of the Max drawdown period.
The third graph can be useful to spot outliers, events in pairs that cause profit spikes.
Possible options for the freqtrade plot-profit subcommand:
usage: freqtrade plot-profit [-h] [-v] [--logfile FILE] [-V] [-c PATH]
                             [-d PATH] [--userdir PATH] [-s NAME]
                             [--strategy-path PATH] [-p PAIRS [PAIRS ...]]
                             [--timerange TIMERANGE] [--export EXPORT]
                             [--export-filename PATH] [--db-url PATH]
                             [--trade-source {DB,file}] [-i TIMEFRAME]

optional arguments:
  -h, --help            show this help message and exit
  -p PAIRS [PAIRS ...], --pairs PAIRS [PAIRS ...]
                        Show profits for only these pairs. Pairs are space-
                        separated.
  --timerange TIMERANGE
                        Specify what timerange of data to use.
  --export EXPORT       Export backtest results, argument are: trades.
                        Example: `--export=trades`
  --export-filename PATH
                        Save backtest results to the file with this filename.
                        Requires `--export` to be set as well. Example:
                        `--export-filename=user_data/backtest_results/backtest
                        _today.json`
  --db-url PATH         Override trades database URL, this is useful in custom
                        deployments (default: `sqlite:///tradesv3.sqlite` for
                        Live Run mode, `sqlite:///tradesv3.dryrun.sqlite` for
                        Dry Run).
  --trade-source {DB,file}
                        Specify the source for trades (Can be DB or file
                        (backtest file)) Default: file
  -i TIMEFRAME, --timeframe TIMEFRAME, --ticker-interval TIMEFRAME
                        Specify ticker interval (`1m`, `5m`, `30m`, `1h`,
                        `1d`).

Common arguments:
  -v, --verbose         Verbose mode (-vv for more, -vvv to get all messages).
  --logfile FILE        Log to the file specified. Special values are:
                        'syslog', 'journald'. See the documentation for more
                        details.
  -V, --version         show program's version number and exit
  -c PATH, --config PATH
                        Specify configuration file (default:
                        `userdir/config.json` or `config.json` whichever
                        exists). Multiple --config options may be used. Can be
                        set to `-` to read config from stdin.
  -d PATH, --datadir PATH
                        Path to directory with historical backtesting data.
  --userdir PATH, --user-data-dir PATH
                        Path to userdata directory.

Strategy arguments:
  -s NAME, --strategy NAME
                        Specify strategy class name which will be used by the
                        bot.
  --strategy-path PATH  Specify additional strategy lookup path.
The -p/--pairs argument, can be used to limit the pairs that are considered for this calculation.
Examples:
Use custom backtest-export file
freqtrade plot-profit -p LTC/BTC --export-filename user_data/backtest_results/backtest-result.json
Use custom database
freqtrade plot-profit -p LTC/BTC --db-url sqlite:///tradesv3.sqlite --trade-source DB
freqtrade --datadir user_data/data/binance_save/ plot-profit -p LTC/BTC