Plotting
This page explains how to plot prices, indicators and profits.
Installation / Setup
Plotting modules use the Plotly library. You can install / upgrade this by running the following command:
pip install -U -r requirements-plot.txt
Plot price and indicators
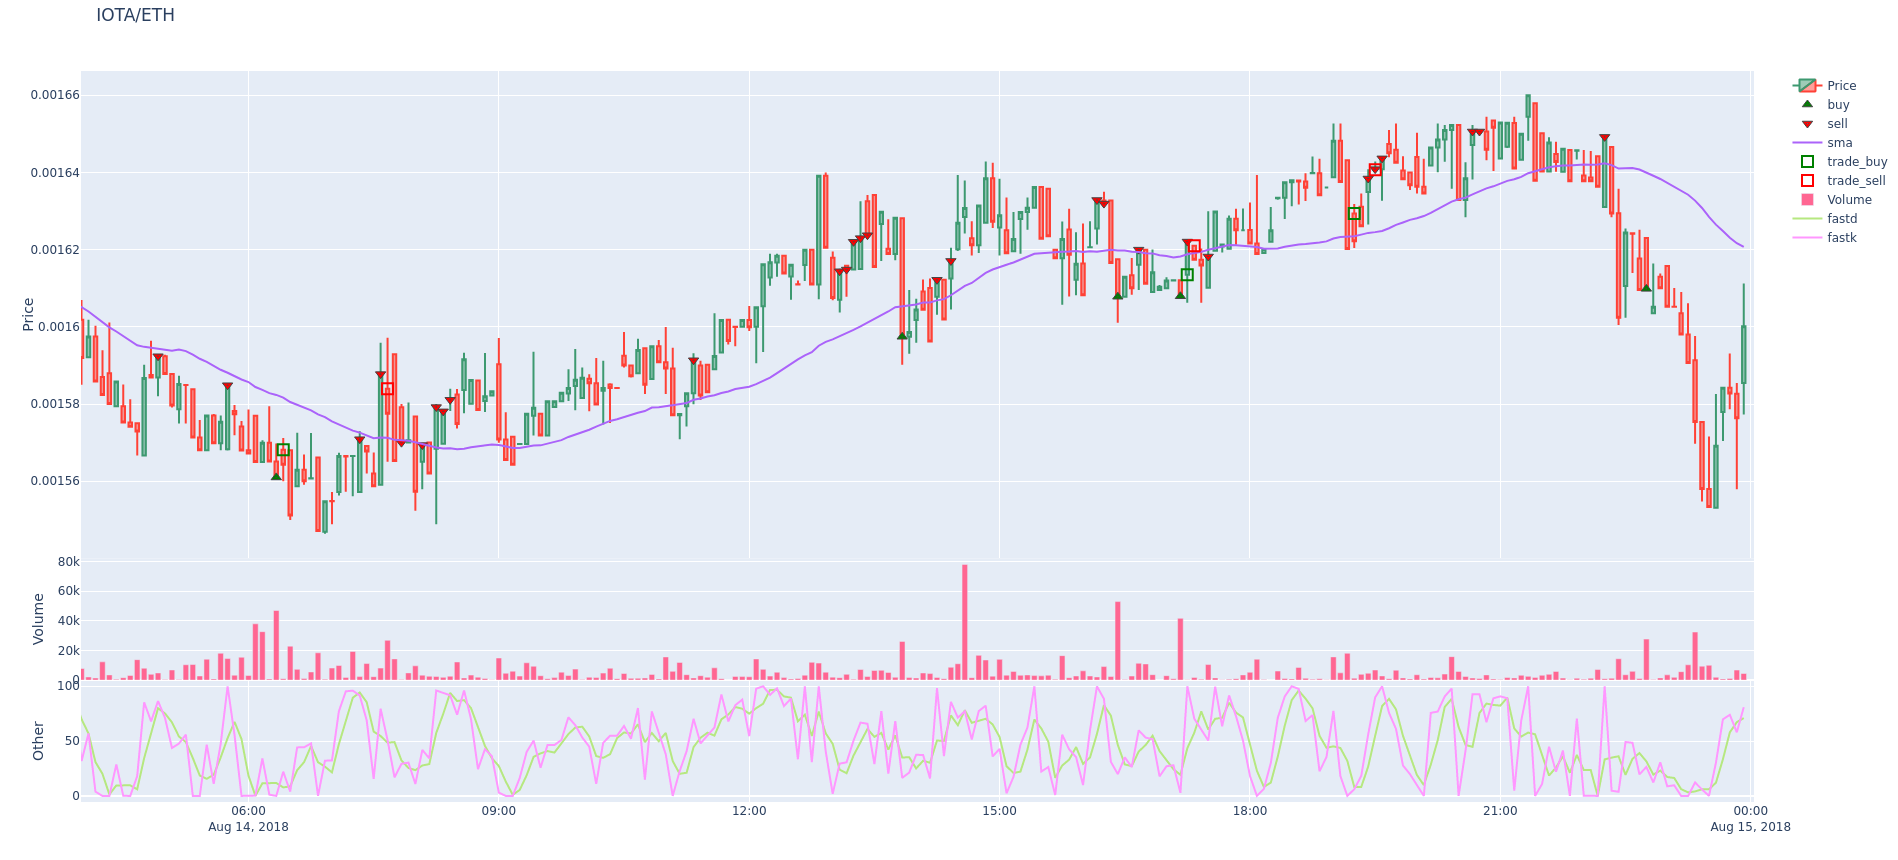
The freqtrade plot-dataframe subcommand shows an interactive graph with three subplots:
- Main plot with candlestics and indicators following price (sma/ema)
- Volume bars
- Additional indicators as specified by
--indicators2
Possible arguments:
usage: freqtrade plot-dataframe [-h] [-p PAIRS [PAIRS ...]]
                                [--indicators1 INDICATORS1 [INDICATORS1 ...]]
                                [--indicators2 INDICATORS2 [INDICATORS2 ...]]
                                [--plot-limit INT] [--db-url PATH]
                                [--trade-source {DB,file}] [--export EXPORT]
                                [--export-filename PATH]
                                [--timerange TIMERANGE]

optional arguments:
  -h, --help            show this help message and exit
  -p PAIRS [PAIRS ...], --pairs PAIRS [PAIRS ...]
                        Show profits for only these pairs. Pairs are space-
                        separated.
  --indicators1 INDICATORS1 [INDICATORS1 ...]
                        Set indicators from your strategy you want in the
                        first row of the graph. Space-separated list. Example:
                        `ema3 ema5`. Default: `['sma', 'ema3', 'ema5']`.
  --indicators2 INDICATORS2 [INDICATORS2 ...]
                        Set indicators from your strategy you want in the
                        third row of the graph. Space-separated list. Example:
                        `fastd fastk`. Default: `['macd', 'macdsignal']`.
  --plot-limit INT      Specify tick limit for plotting. Notice: too high
                        values cause huge files. Default: 750.
  --db-url PATH         Override trades database URL, this is useful in custom
                        deployments (default: `sqlite:///tradesv3.sqlite` for
                        Live Run mode, `sqlite://` for Dry Run).
  --trade-source {DB,file}
                        Specify the source for trades (Can be DB or file
                        (backtest file)) Default: file
  --export EXPORT       Export backtest results, argument are: trades.
                        Example: `--export=trades`
  --export-filename PATH
                        Save backtest results to the file with this filename
                        (default: `user_data/backtest_results/backtest-
                        result.json`). Requires `--export` to be set as well.
                        Example: `--export-filename=user_data/backtest_results
                        /backtest_today.json`
  --timerange TIMERANGE
                        Specify what timerange of data to use.
Example:
freqtrade plot-dataframe -p BTC/ETH
The -p/--pairs argument can be used to specify pairs you would like to plot.
Note
The freqtrade plot-dataframe subcommand generates one plot-file per pair.
Specify custom indicators.
Use --indicators1 for the main plot and --indicators2 for the subplot below (if values are in a different range than prices).
Tip
You will almost certainly want to specify a custom strategy! This can be done by adding -s Classname / --strategy ClassName to the command.
freqtrade --strategy AwesomeStrategy plot-dataframe -p BTC/ETH --indicators1 sma ema --indicators2 macd
Further usage examples
To plot multiple pairs, separate them with a space:
freqtrade --strategy AwesomeStrategy plot-dataframe -p BTC/ETH XRP/ETH
To plot a timerange (to zoom in)
freqtrade --strategy AwesomeStrategy plot-dataframe -p BTC/ETH --timerange=20180801-20180805
To plot trades stored in a database use --db-url in combination with --trade-source DB:
freqtrade --strategy AwesomeStrategy plot-dataframe --db-url sqlite:///tradesv3.dry_run.sqlite -p BTC/ETH --trade-source DB
To plot trades from a backtesting result, use --export-filename <filename>
freqtrade --strategy AwesomeStrategy plot-dataframe --export-filename user_data/backtest_results/backtest-result.json -p BTC/ETH
Plot profit
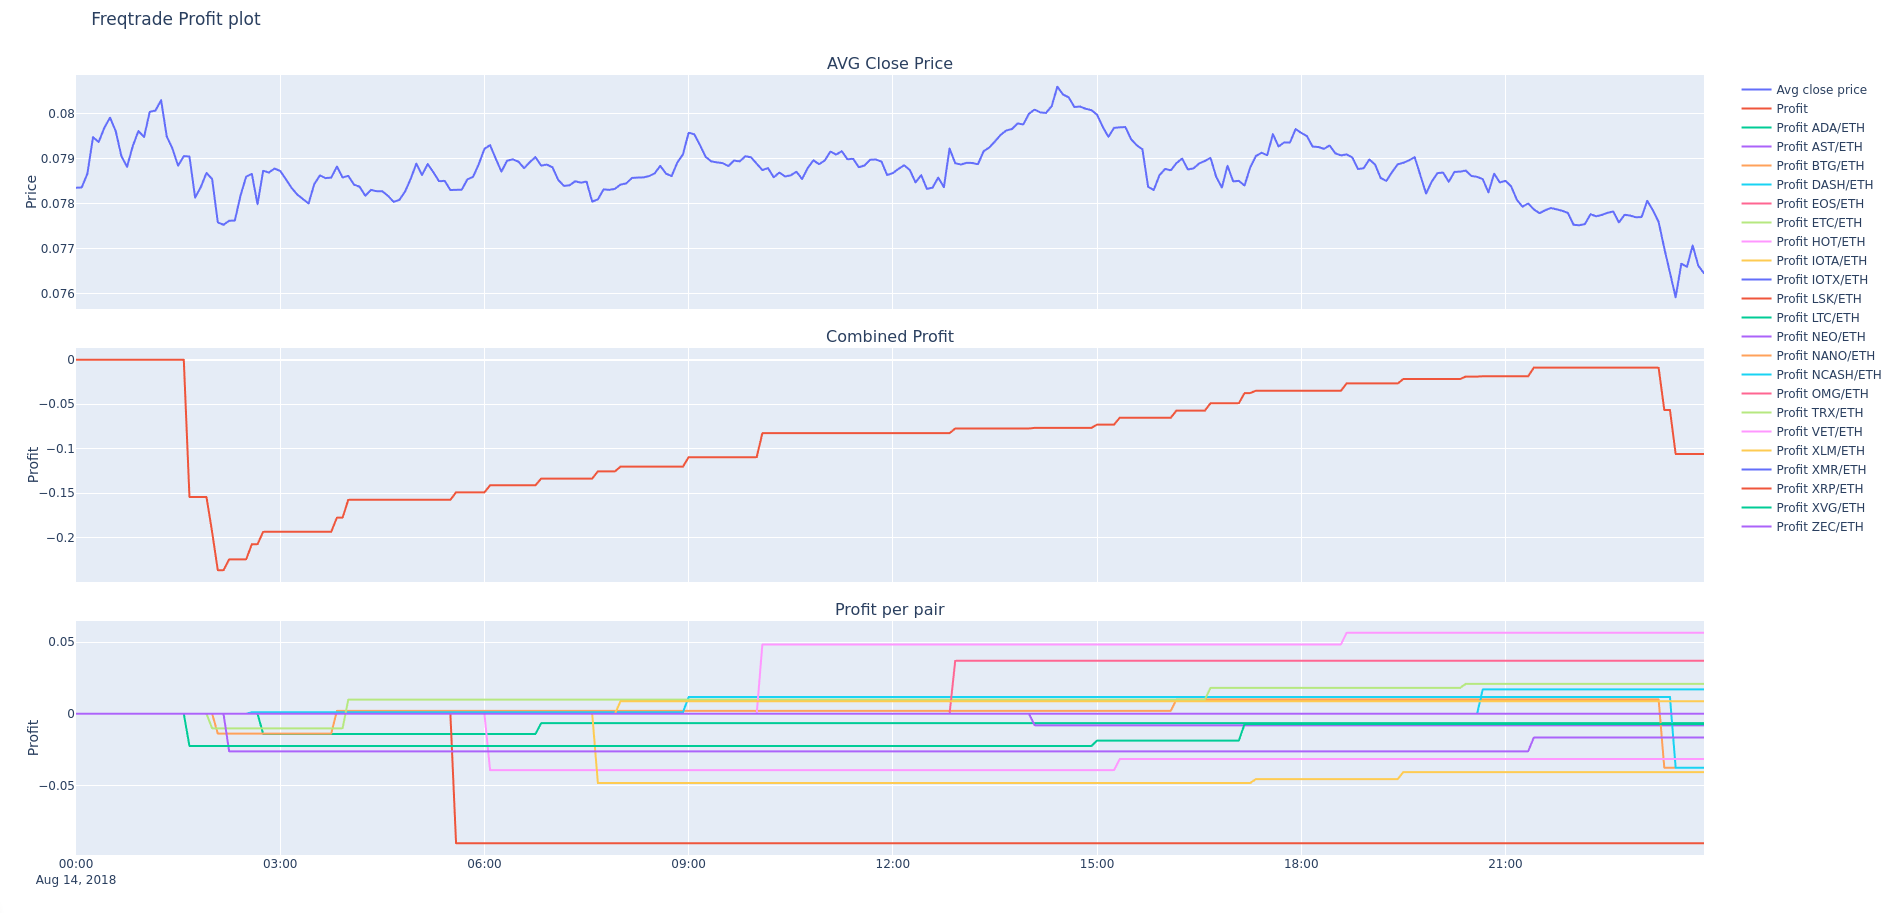
The freqtrade plot-profit subcommand shows an interactive graph with three plots:
1) Average closing price for all pairs 2) The summarized profit made by backtesting. Note that this is not the real-world profit, but more of an estimate. 3) Profit for each individual pair
The first graph is good to get a grip of how the overall market progresses.
The second graph will show if your algorithm works or doesn't. Perhaps you want an algorithm that steadily makes small profits, or one that acts less often, but makes big swings.
The third graph can be useful to spot outliers, events in pairs that cause profit spikes.
Possible options for the freqtrade plot-profit subcommand:
usage: freqtrade plot-profit [-h] [-p PAIRS [PAIRS ...]]
                             [--timerange TIMERANGE] [--export EXPORT]
                             [--export-filename PATH] [--db-url PATH]
                             [--trade-source {DB,file}]

optional arguments:
  -h, --help            show this help message and exit
  -p PAIRS [PAIRS ...], --pairs PAIRS [PAIRS ...]
                        Show profits for only these pairs. Pairs are space-
                        separated.
  --timerange TIMERANGE
                        Specify what timerange of data to use.
  --export EXPORT       Export backtest results, argument are: trades.
                        Example: `--export=trades`
  --export-filename PATH
                        Save backtest results to the file with this filename
                        (default: `user_data/backtest_results/backtest-
                        result.json`). Requires `--export` to be set as well.
                        Example: `--export-filename=user_data/backtest_results
                        /backtest_today.json`
  --db-url PATH         Override trades database URL, this is useful in custom
                        deployments (default: `sqlite:///tradesv3.sqlite` for
                        Live Run mode, `sqlite://` for Dry Run).
  --trade-source {DB,file}
                        Specify the source for trades (Can be DB or file
                        (backtest file)) Default: file
The -p/--pairs argument, can be used to limit the pairs that are considered for this calculation.
Examples:
Use custom backtest-export file
freqtrade plot-profit -p LTC/BTC --export-filename user_data/backtest_results/backtest-result-Strategy005.json
Use custom database
freqtrade plot-profit -p LTC/BTC --db-url sqlite:///tradesv3.sqlite --trade-source DB
freqtrade --datadir user_data/data/binance_save/ plot-profit -p LTC/BTC